


A Brief Tutorial on Sampling Error for Reporters
Paul Gronke
A colleague saw me in the hallway recently and quipped "I love standard errors!" He was referring to a report we'd both recently read that cited survey data but didn't provide any standard errors. We were both good enough at math to realize that the differences were almost surely not statistically significant.
Once your eyes stop rolling about what constitutes humor to a pair of data nerds, the point of his comment is important for anyone who works with survey or sample data to understand. Numerical estimates take on artificial precision if you don't apply the basic mathematics of sampling. And this math can get a bit more complicated when you aren't looking at the whole sample but at a subset.
Everyone knows this intuitively. If I roll a pair of dice 1000 times, you're a lot more confident that the dice aren't loaded than if I roll the dice 10 times. The mistake that a lot of people make is that they don't realize the same logic applies to subsets of a sample. Even if you have a sample of 500 respondents and an estimated sampling error of 4.5%, a subsample of 50 respondents has a correspondingly high sampling error. (For the mathematically inclined, the standard error of the second quantity will be SQRT(10) = 3.16 larger, or 14.05%.)
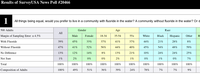
All this is relevant to the recently released KATU/Survey USA poll on fluoridating Portland's water supply.
One thing in the story immediately caught my eye.:
When you break down the votes by race, there's a huge difference. Forty-two percent of white voters say they’d vote yes, but only 30 percent of black and Asian voters agree. What’s more, 9 percent of Hispanic voters support fluoridation (72 percent said no.)
I've been working with public opinion data for a long time, and I'm used to seeing substantial differences between racial and ethnic groups. But I can't think of an instance where I have seen differences these substantial, and groups organized in this way (typically, Whites and Blacks anchor opposite ends and Hispanics are in the middle).
Could this be true? Why would Hispanic support be in the single digits while Black, White, and Asian support was between 30 and 45%? Did this have something to do with where Hispanics live, what media they access, what groups they are listening to?
Ah. Wait. The answer is a lot simpler than that. The Latino number is almost certainly wrong, and is a result of a particularly bad roll of the survey sampling dice by Survey USA.
If you dive into the Survey USA numbers, you can find the poll results from a question asked on 4/25/13. It shows White support at 44%, Hispanic support at 28%, and Black support at 21%.
The next poll is the one currently highlighted at KATU's website. This is the poll that showed Hispanic support at only 9%. What makes this very suspicious is that every other demographic group shows support and opposition levels nearly identical to three weeks earlier.
It could be that the question wording about the actual ballot prompted the 75% drop in support among Latinos only and not Whites, Blacks, Democrats, Independents, Young People, Old People etc. Much more likely, however, is that this is a case of sampling error. There are only 35 Hispanics in the survey (7% of 500), so applying the formula for the standard error of a proportion, the standard error is not plus or minus 4.5%, but plus or minus 16.5%.
Unfortunately for KATU, the final poll by Survey USA shows exactly this (the KATU story is here). It shows Hispanic support at 34%.
Ouch. That's gotta hurt.
You could believe that 28% of Hispanics supported fluoride in late April, 9% supported it a week ago, and now 34% support it. Or you can chalk this up to sampling error and stop writing about differences based on a few dozen cases.
Here's what I always tell my students: rely on your intuition and political knowledge. Learn about and use standard errors. And if the survey numbers tell you something unbelievable, it's probably unbelievable. Don't include it in your class paper and surely don't trumpet it in the media.
 |
More Recent Posts | |
Albert Kaufman |
|
Guest Column |
|
Kari Chisholm |
|
Kari Chisholm |
Final pre-census estimate: Oregon's getting a sixth congressional seat |
Albert Kaufman |
Polluted by Money - How corporate cash corrupted one of the greenest states in America |
Guest Column |
|
Albert Kaufman |
Our Democrat Representatives in Action - What's on your wish list? |
Kari Chisholm |
|
Guest Column |
|
Kari Chisholm |
|
connect with blueoregon


